HSCGD Human Single Cell Genome Database
Examples: SRR5514771,SRR5514758,SRR5514743,SRR5514724,SRR5514705
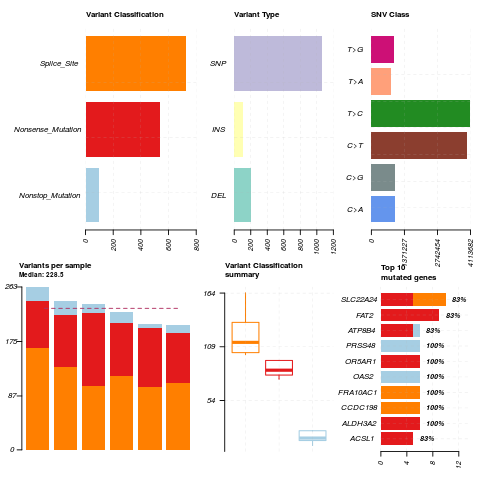
SNV Summary Results
The chart shows sample mutation counts, type distribution, mutation frequency, and common mutated genes.
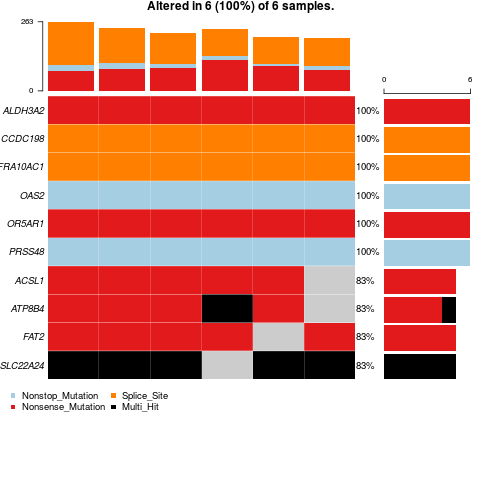
SNV Oncoplot
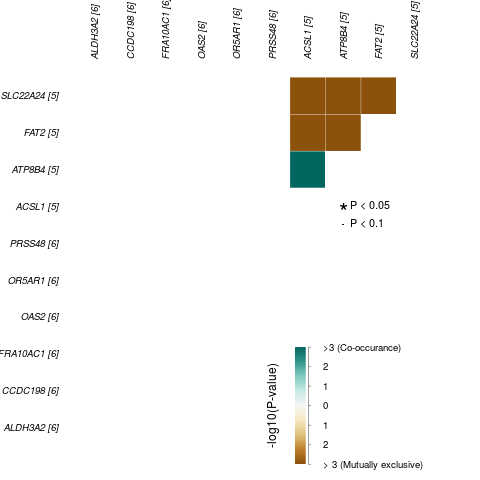
The first image (Oncoplot) displays the mutation status of various genes across samples, with each color indicating a different mutation type. The second image (Interaction Plot) shows the co-occurrence and mutual exclusivity of gene mutations, with the color intensity representing statistical significance.
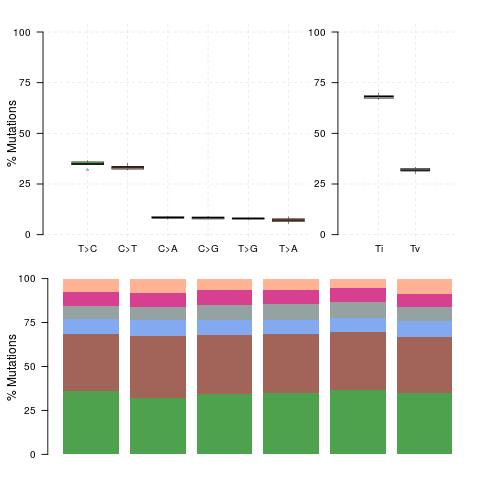
SNV Titv Results
The chart displays the proportion of each type of single nucleotide variation and the transition/transversion (Ti/Tv) ratio.
For questions and suggestions, please contact: heshiyang@seu.edu.cn © HSCGD. State Key Laboratory of Digital Medical Engineering, Southeast University
苏ICP备2024124065号